About Course
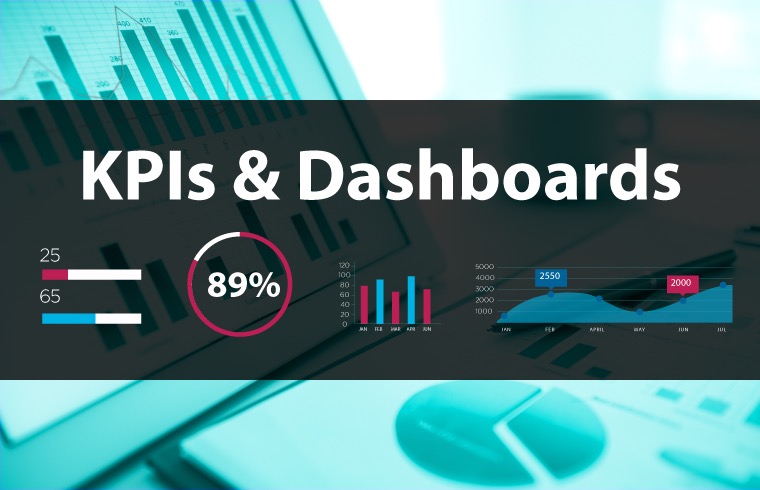
The course reveals both the framework and practices of dashboards including construction metrics and KPIs. It shows the creation of different elements such as Gantt chart, dial gauge, progress circle, pivot table, and progress curve.
Course Content
Framework
-
Metrics and KPIs
03:48 -
Common Sizing and Trend Analysis
04:01 -
Variance Vs Index
05:49 -
Develop your own KPIs
05:23
KPIs & Metrics Dictionary
Gantt Chart
Dial Gauge & Progress Circle
Pivot Tables & Slicers
Progress Curve
Conditional Format
Dashboard Development
Student Ratings & Reviews
Perfect, thanks for your effort
جهد مشكور بشمهندس .. عندي ملاحظة لو تكرمتم وهي أن الدورة مسجلة من 2018 والدنيا تغيرت وتطورت .. الاكسل والرسام ربما ما زالا أدوات مفيدة ولكنها ليست بقيمة ما استجد من أدوات.
الدورة تحتاج تحديث حتما.
الدورة تحتاج تحديث حتما.
I`m Expect more value becouse I`m actually working as planner for along time
very good for me
Very organized and fruitful
thats one of the courses i learned fom him thank you very much but i need all files from courses i dont find any this
the KPIs & Dashboards course is a well-structured program that equips participants with essential skills for effective project management. It enhances dashboard creation and data visualization capabilities.
full of useful information


power bi داشبورد مبسط ببرنامج